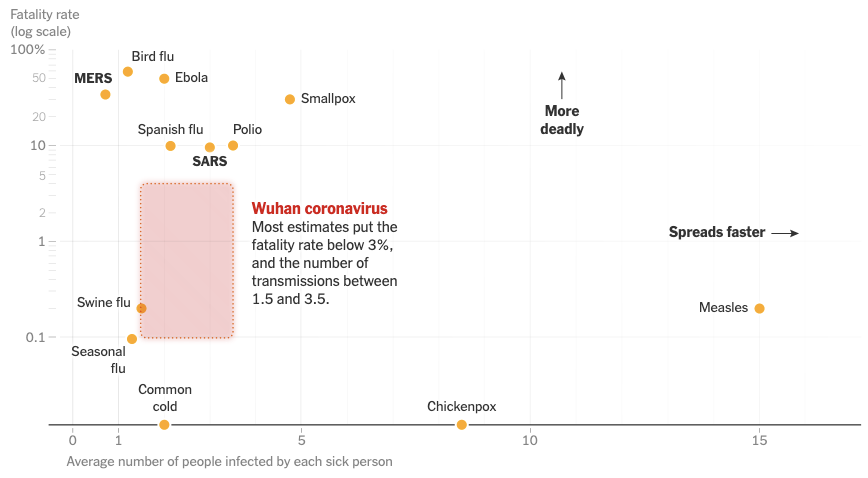
Jan 31, 2020, 12:46 PM on X Digging how they represent uncertainty on this chart… top notch visual from nyt as usual.